
PowerTSM® Visuals – detect the expected, explore the unexpected.
The PowerTSM® Visuals were developed by VRVis - Zentrum für Virtual Reality und Visualisierung Forschungs-GmbH - in cooperation with HAKOM Time Series GmbH and Data Scientists from the energy industry.
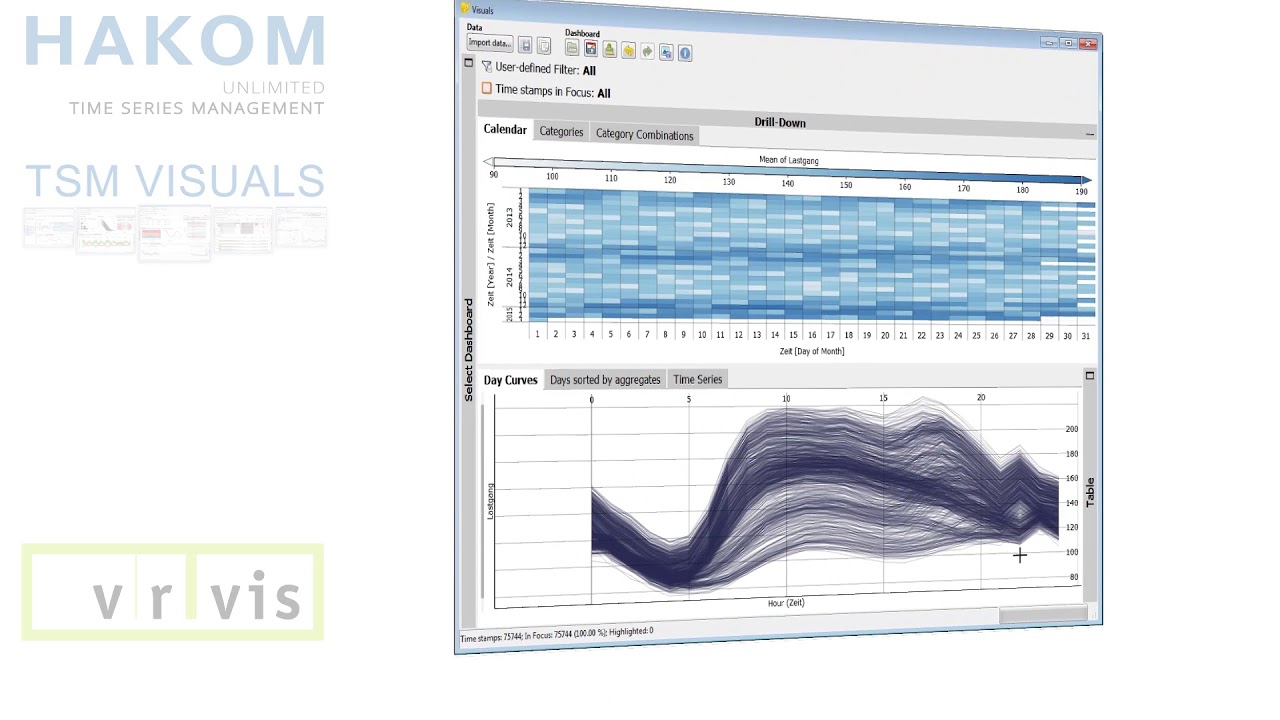
The VRVis works with the latest findings of research and development in the field of visual computing and has developed an outstanding technology for the visual exploration of large and heterogeneous amounts of data. Simultaneous views of the data enable insights that would not be possible using statistics alone, because seeing is understanding.
In this way, data can be quickly validated, forecast models evaluated or price data checked for suspicion of manipulation. Intuitive and productive, correlations in data are visually recognized.
Due to the integration into the PowerTSM® App, the HAKOM PowerTSM® Visuals are excellently suited for the analysis of data with relevance to the energy industry. The visual exploration of data from different sources is started directly from the PowerTSM® App. In all areas of the energy industry there is a wealth of highly interesting application areas, which make completely new insights possible through the use of HAKOM PowerTSM® Visuals.
PowerTSM® Visuals data preparation – create a basis for valid statements:
- Detection of anomalies, errors etc., without a priori hypotheses.
- Selection and export of any subsets.
- Preparation according to almost any criteria.
- Clustering according to time-structured profiles.
PowerTSM® Visuals Exploration – efficient analysis options for the Data Scientist:
- Gain feeling and understanding for large, complex amounts of data.Identification of arbitrary patterns (e.g. clusters, outliers, trends etc.).
- Quantification of patterns by descriptive statistics.
- Recognize and understand contexts.
PowerTSM® Visuals Process Development – quality assurance for complex processes:
- Analysis of variant calculations and black box systems..
- Interactive validation of models and analysis of deviations.
- Interactive multi-target optimization.
PowerTSM® Visual 3.0 Clip
Learn more – Features PowerTSM® Visuals.
The data connection is done directly from the PowerTSM® App, which is integrated in MS ExcelTM. Data can be supplemented and replaced interactively. Optionally, PowerTSM® Visuals support an interface in Comma Separated Value (CSV) format. Numerical and categorical data, date and time specifications are supported as well as functional entries, such as measurements available as time series. Missing data is also highlighted and can be treated separately.
The results of the visual analyses can be fed back to the different data sources. HAKOM PowerTSM® Visuals enable the creation of complex rules for the correction and evaluation of input data. The modified data can be saved back to the PowerTSM® database. The PowerTSM® Technology provides extensive auditing functions in order to trace the change processes and to check their plausibility.
- Validation of meteorological data for wind energy generation and consumption forecasts.
- Vodeling support of forecasting models of energy consumption and generation.
- Analysis of data to retrieve control energy in second increment.
- Quality analysis of transformer systems of different manufacturers in the high-voltage grid.
- Clustering of daily load profiles according to different aspects.
The PowerTSM® Visuals can be licensed in different packages per user. The packages scale with the number of available views, and are tailored to different application scenarios and user requirements and expertise.
The cost of a PowerTSM® Visual Subscription starts at 249,- € p.m. Please note that this is an additional charge to the subscription of the MS ExcelTM Plug-In.
For further information please contact us!
HAKOM – a strong partner in the energy sector for 30 years.
